
Introduction#
A memory leak occurs when a program allocates memory dynamically (e.g., using malloc) and fails to release it using free. This leftover allocation can lead to wasted memory resources, eventually causing slowdowns or system crashes in long-running programs.
Valgrind is a powerful command-line tool available on Linux systems. It helps developers detect:
- Memory leaks
- Invalid memory access
- Uninitialized memory usage
- Mismatched memory management
In this guide, we’ll walk through examples in C to learn how to detect and fix memory leaks using Valgrind.
Installing Valgrind#
On Arch Linux#
sudo pacman -S valgrind
On Ubuntu/Debian#
sudo apt install valgrind
On Fedora#
sudo dnf install valgrind
Troubleshooting: Valgrind “cannot find mandatory redirection” on Arch Linux#
If you run Valgrind and get an error like:
valgrind: Fatal error at startup: a function redirection
valgrind: which is mandatory for this platform-tool combination
valgrind: cannot be set up.
…you might be running a 32-bit executable on a 64-bit Arch Linux system.
Why this happens#
Valgrind needs to hook into low-level glibc functions from your binary’s architecture.
If your binary is 32-bit, Arch requires the 32-bit glibc runtime (lib32-glibc).
Without it, Valgrind can’t find the right function symbols and quits.
Fix#
Install the 32-bit glibc package:
sudo pacman -S lib32-glibc
After installation, re-run:
valgrind ./your-binary
and it should work.
Ubuntu/Debian equivalent:
sudo apt install libc6-dbg:i386
Basic Example: Hello World#
Code#
#include <stdio.h>

int main() {
    printf("Hello World\n");
    return 0;
}
Compile and Run#
gcc main.c -o main.out
./main.out
Run with Valgrind#
valgrind ./main.out
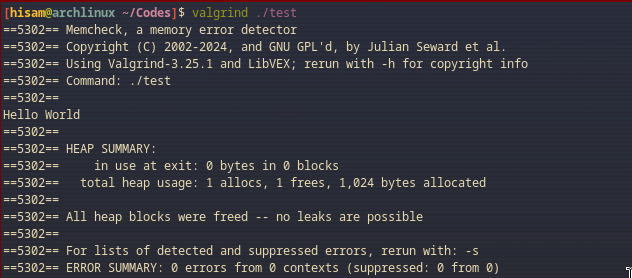
You should see no errors or memory leaks in the output.
Introducing a Memory Leak#
Static Allocation (Safe)#
#include <stdio.h>

int main() {
    char str[20] = "Hello";
    printf("%s\n", str);
    return 0;
}
This uses stack memory, so Valgrind will report no leaks.
Dynamic Allocation (With Leak)#
#include <stdio.h>
#include <stdlib.h>
#include <string.h>

int main() {
    char *str = malloc(20);
    strcpy(str, "Hello");
    printf("%s\n", str);
    return 0; // Forgot to free memory
}
Valgrind Output#
valgrind ./main.out
You should see:
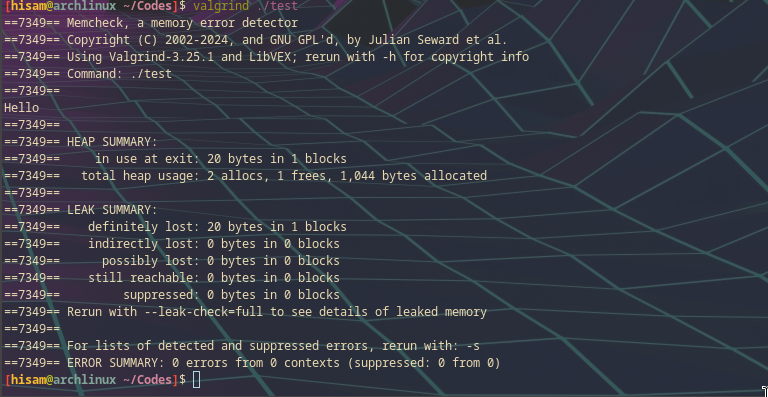
definitely lost: 20 bytes in 1 blocks
Fixing the Memory Leak#
Add free(str); before returning:
free(str);
Fixed Code#
#include <stdio.h>
#include <stdlib.h>
#include <string.h>

int main() {
    char *str = malloc(20);
    strcpy(str, "Hello");
    printf("%s\n", str);
    free(str);
    return 0;
}
Detailed Valgrind Options#
Use for deeper analysis:
valgrind --leak-check=full ./main.out
Or even more detailed:
valgrind --leak-check=full --show-leak-kinds=all --track-origins=yes ./main.out
Explanation:
--leak-check=full: Display detailed leak info--show-leak-kinds=all: Show all kinds of leaks (definitely, indirectly lost, etc.)--track-origins=yes: Show where uninitialized values originate
Summary#
- Always
free()memory allocated withmalloc(),calloc(), orrealloc(). - Close all file streams with
fclose(). - Use Valgrind to identify and fix:
- Memory leaks
- Invalid memory writes
- Use-after-free bugs
- Recommended command:
valgrind --leak-check=full --track-origins=yes ./your_program
Valgrind is a critical tool for writing safe, efficient, and bug-free C programs.